At IDRSolutions we are always innovating, one of our latest projects is a JavaFX implementation of our Swing PDF Viewer. Naturally, with all software, there’s bugs to squash and problems to tackle.
Most of the development team at IDRSolutions use the NetBeans IDE. Luckily for us, NetBeans comes with a fantastic debugger and profiler that can help hunt down those bugs and optimise your code!
This tutorial/blog will highlight the main things you need to know to get debugging in NetBeans.
The Scenario
Imagine we have a car, we know the x1 and y1 of the cars current position, and we want to get the car to the petrol station which is located at x2 and y2. We also know the speed of the car, so we want to know how long it will take for the car from its current position (x1,y1) to reach the petrol station (x2,y2).
We have the distance which we can get from a method/formula in our code.
We know the distance because we know what x1,y1 and what x2,y2 equal so we can plug these into our distance formula to get the distance from the car to the petrol station.
And we know the Speed of the car.
We don’t know the time.
So naturally, we’d use ye ol’ faithful time = distance / speed.
However when we run our code. We notice that the car isn’t taking X amount of time to get to the petrol station, it’s taking 0 amount of time. So something must be wrong with our numbers right?
And so enters the debugger….
Break Point
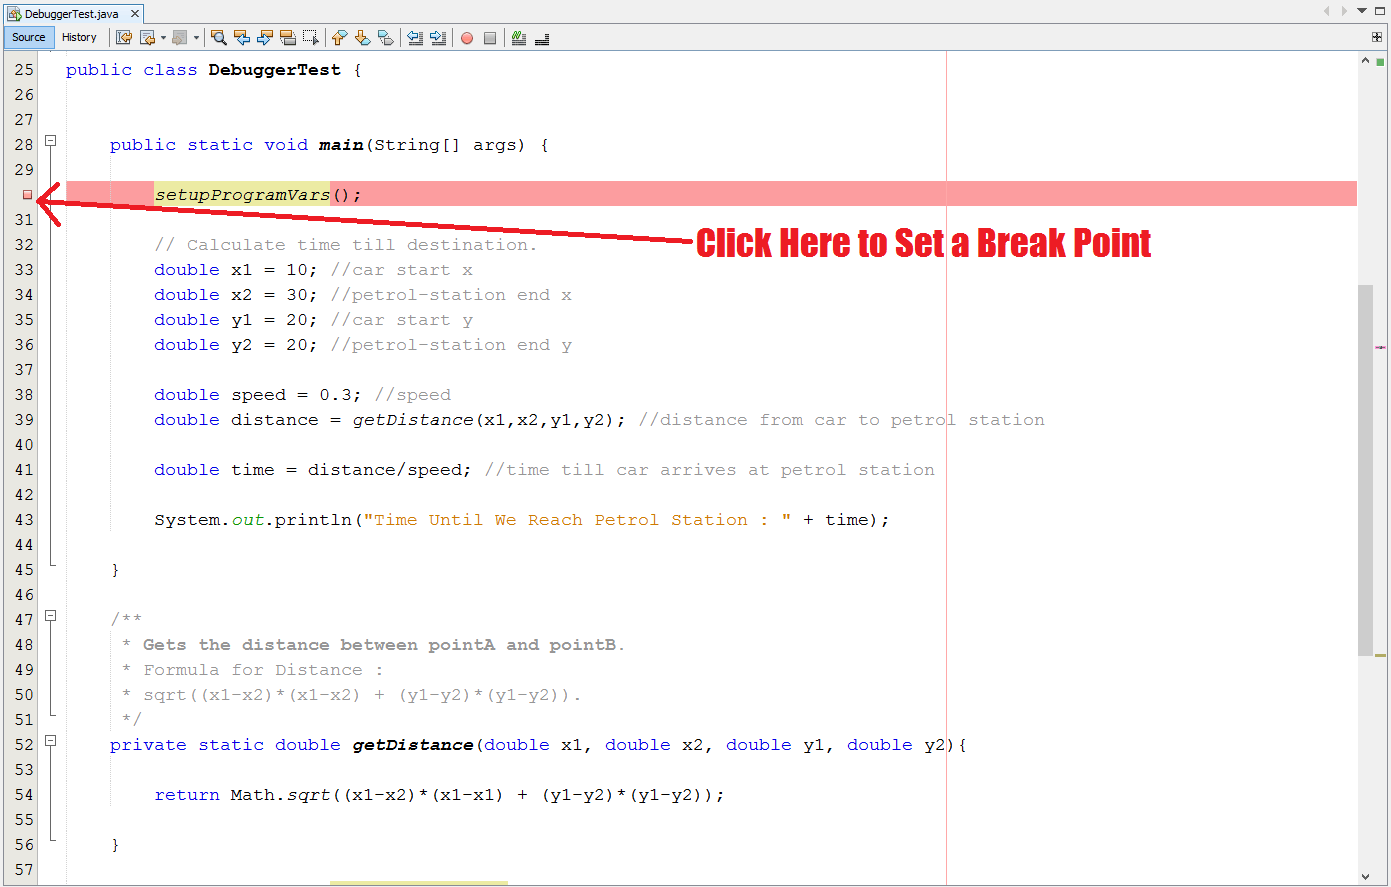
In NetBeans, to use the debugger correctly, we first must set a break point. What this means is that when we run our debugger, the program will run until it gets to the line of code where we set our breakpoint. When we get to this line of code the debugger will kick in and the program will pause, we can then slowly follow the flow/order of execution that the program is taking which makes finding problematic code much easier..
So lets begin by first setting a break point.
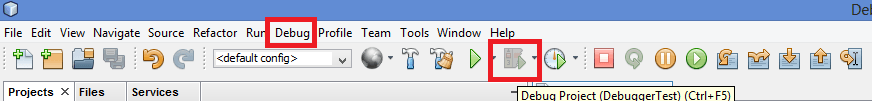
Ok so now we have set our break point, we can run the debugger. To do this we click the debug project button or we can go to the menu at the top and press Debug > Debug Project.
Step Into
Now that we have run our debugger and it has paused at the line of code where we set our break-point, we can step into the code and see what’s going on. Stepping into the code allows you to read every-line of code in the order that your program is executing from where you set your break point. So let’s press the Step Into button and see where it takes us…
Hmm this is strange, this code seems to be just setting up our program, we get a strong feeling none of this is related to the bug we trying to fix…
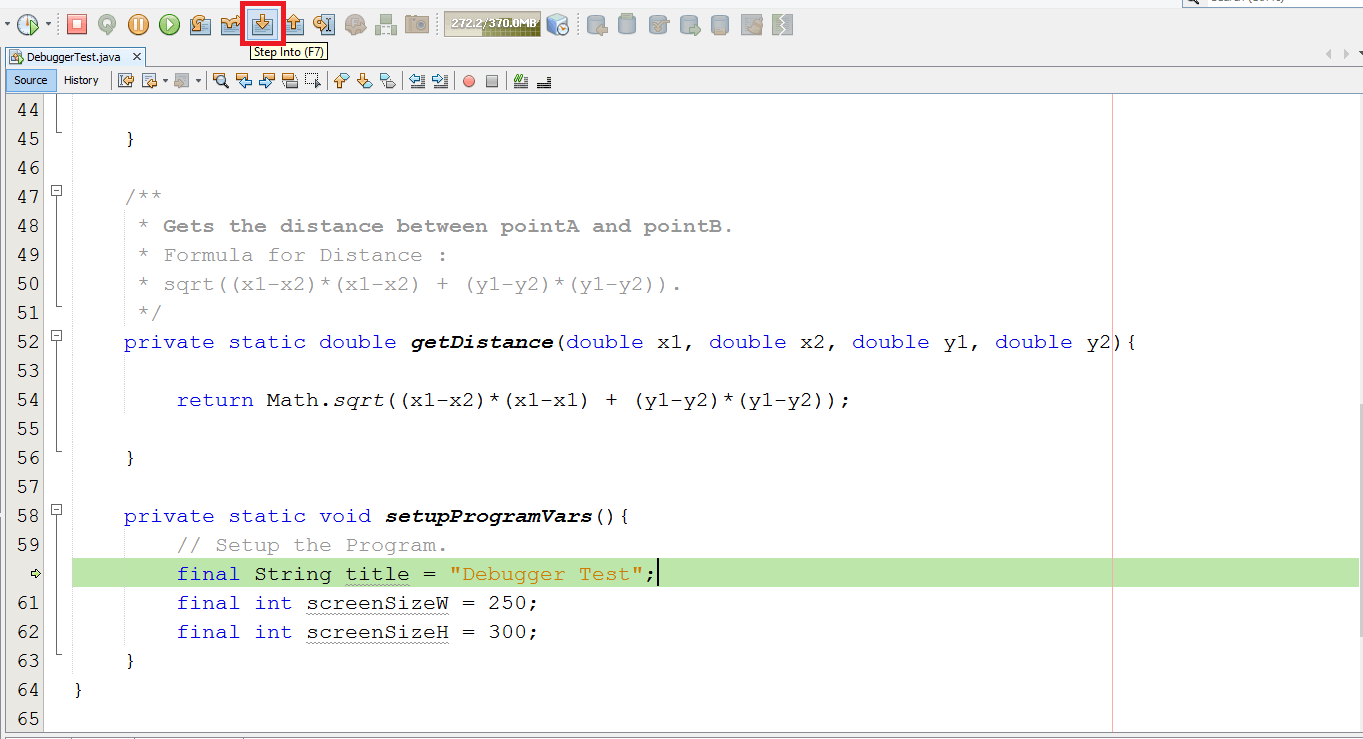
What’s happened is that we set our break-point on a line of code which is calling a method. When we have press Step Into, the debugger has taken us to the first line of code of that method (because that’s the line our program is going to execute next). However we noticed that the method we Stepped Into has nothing to do with the bug we’re seeing so lets Step Out.
Step Out
Press the step out button as illustrated in the picture, it should jump us out of the setupProgramVars() method and onto the next line of code. Things are starting to look a little more interesting now, we’re starting to step through relevant values, one of which could potentially be the bug.
Now that we know what Stepping Into and Stepping Out does, we can learn about Stepping Over.
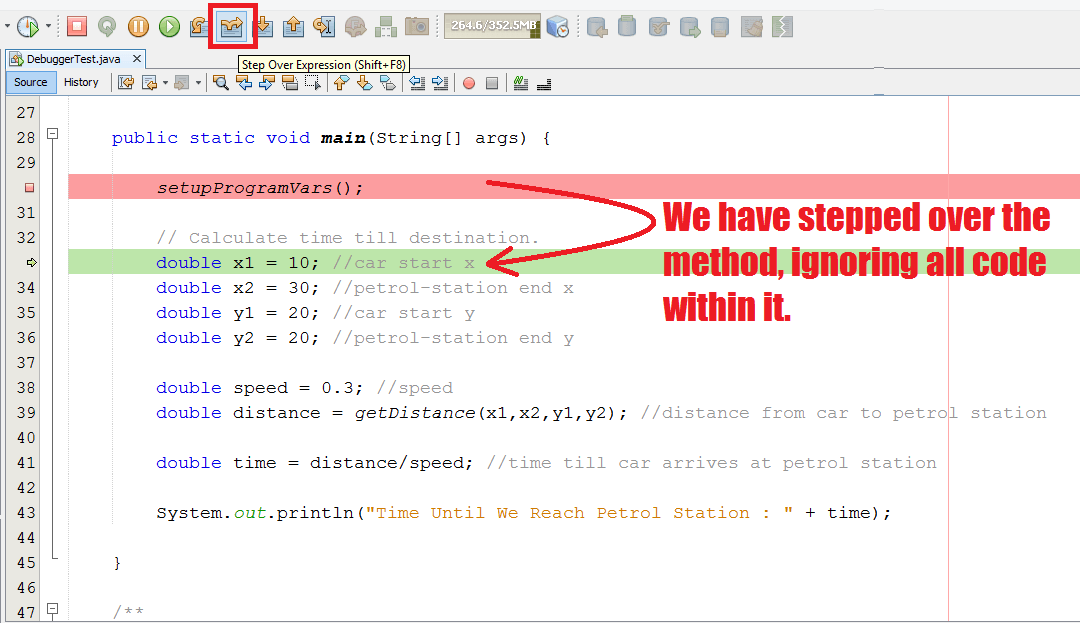
Step Over
If you’re stepping through code, and you step onto a line of code which calls a method that you know for a fact has nothing to do with the bug you’re encountering then you can step over the method and skip it completely. The advantages of this is that you can step through code much quicker, making the bug search more productive.
Ok, so now we’ve landed on some interesting code which could hold our bug, it’s time to inspect the values and see if they’re correct, it’s now important to step into each method which passes or uses any of these variables as it may contain the bug, so no more stepping over for now.
Finding the Bug
We have looked at our x1,x2,y1,y2, speed and distance variables and they all seem to be assigned a value. So the next thing todo is to figure out which one of these variables is being assigned a wrong value and why.
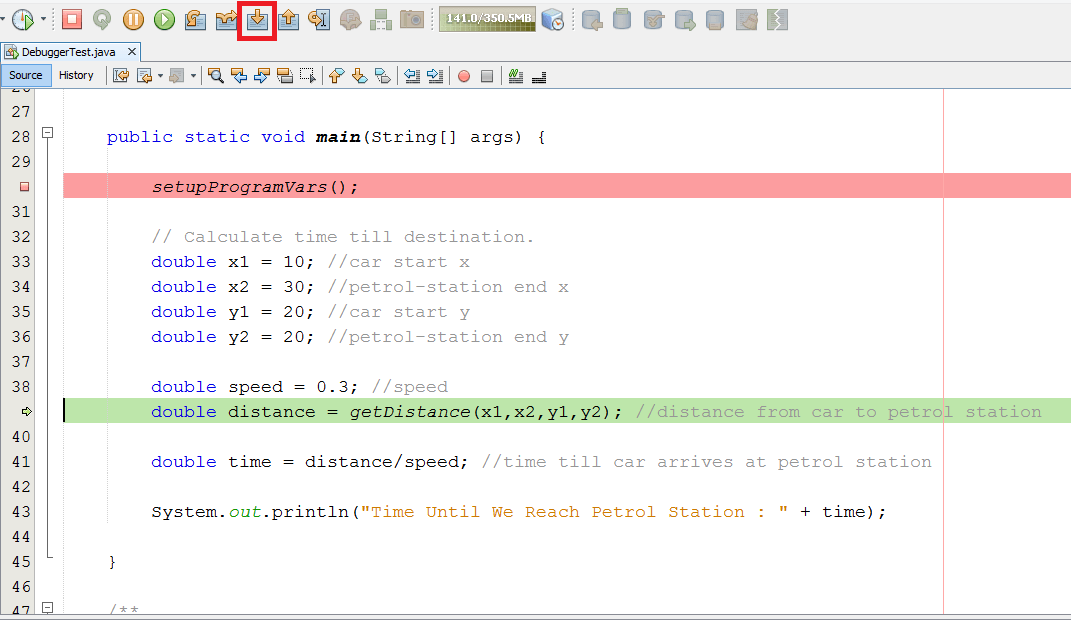
From stepping into each variable we can see that each one we have stepped into has a hard-coded value which seems to be correct. However our distance variable is being assigned a returned value from a method… So it’s possible the returned value is wrong…
Let’s step into the method and have a look.
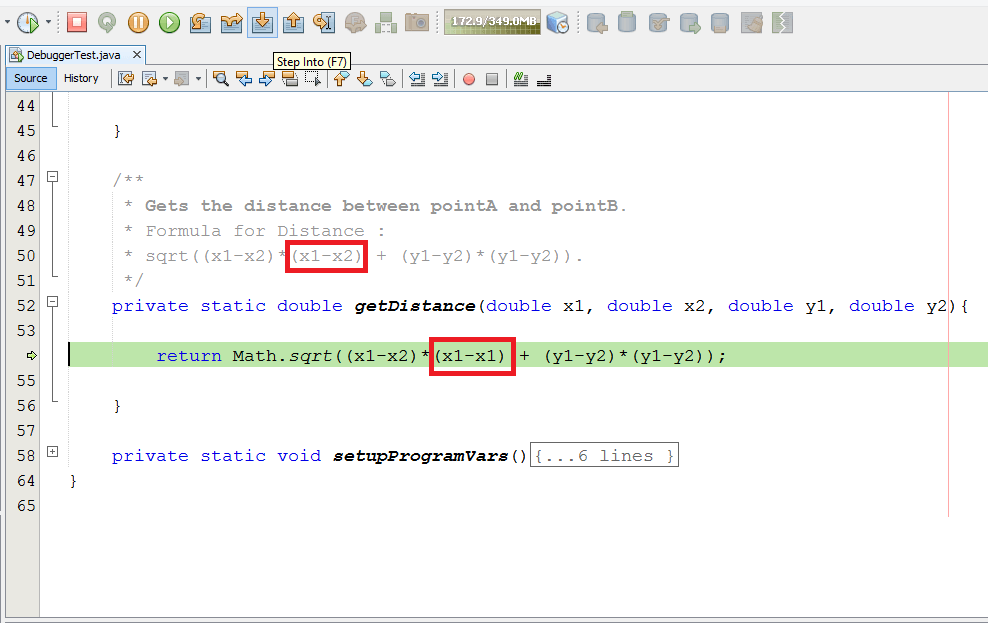
From stepping into the method and looking at the code, we can see that the comments of the method state the formula should be “sqrt ((x1-x2) * (x1-x2)……” However the code that we’re using is “sqrt ((x1-x2) * (x1-x1)……” So we’ve found a bug in the formula, but is it the one we’re looking for?
Using the Variables Window
We have potentially found a bug, but we want to know whether it’s the right one. Wwe are going to use the Variables window (can be turned on via menu Window > Debugging > Variables) to see what the value of distance is after we have assigned it a return value from this method.
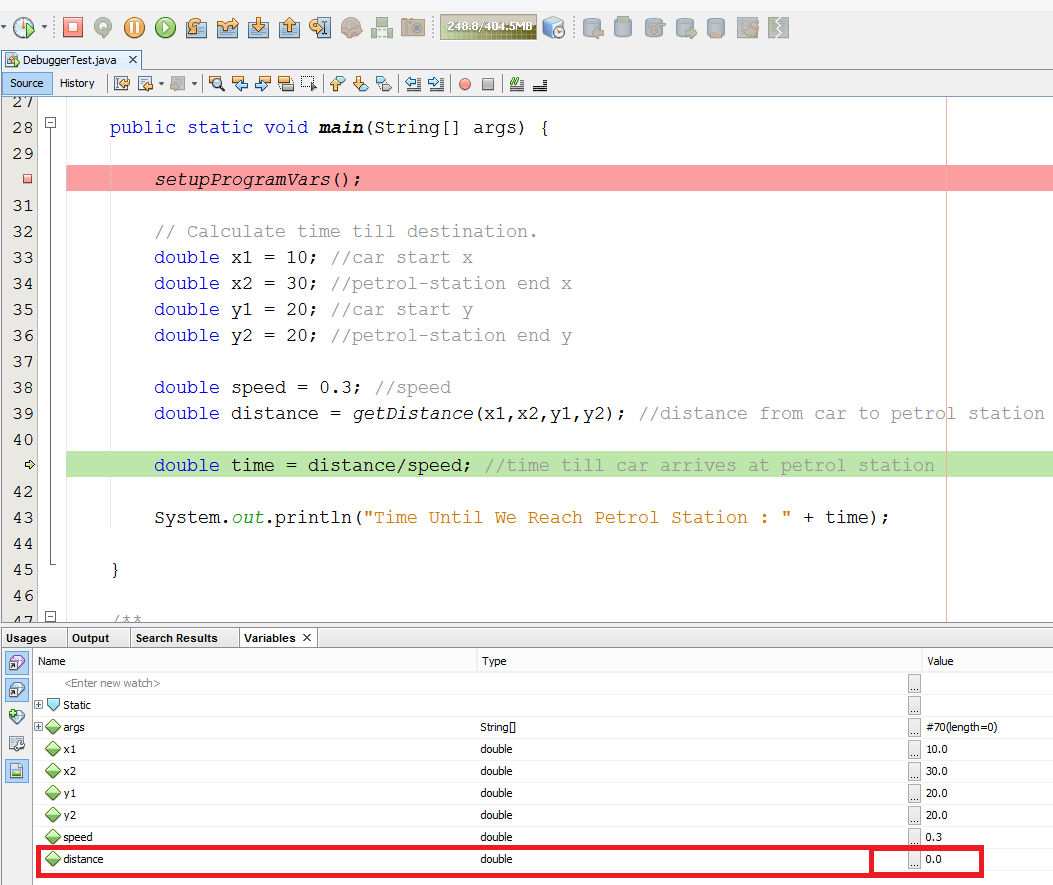
As we can see, distance is 0.0, when it should be a number greater than 0 unless our car is on top of the petrol station. So we’ve found the bug, the formula was wrong and it was causing an incorrect return value for our distance variable.
Fixing the Bug
Now we have a pretty good idea what is causing the bug, we can go back and fix the formula to how it was described in the comments. Now we know the method that potentially holds the bug we can change the location of our break point to where the method is called which will save us having to step through code we have already looked at.
So let’s amend the formula and re-run the debugger with our new break point to see what we get.
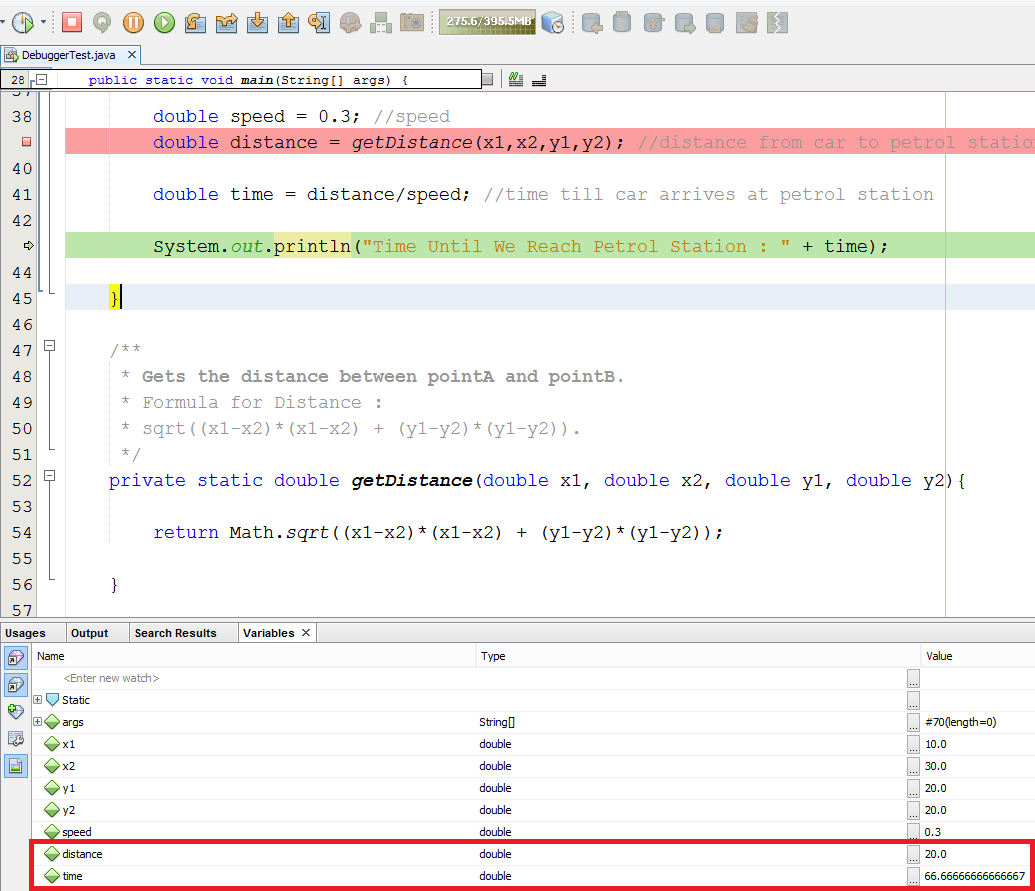
As we can see, our distance variable is now reporting with a value of 20.0, which according to the formula all checks out! We have fixed the bug which was causing us to receive a time of 0, time is now reporting a value of 66.67.
This tutorial was to highlight the power and simplicity of NetBeans debugging tools, we have successfully debugged a program and fixed a formula which was returning an incorrect value.
Thank you for reading, I hope you enjoyed this article and will find it of use. If you have any questions, please post them in the comments section bellow.
You may find some of my JavaFX articles of interest :
- How to Copy Text in JavaFX and Swing
- How to Change Color Space from Swing to JavaFX
- How to Change the Mouse Cursor in JavaFX
- How to Setup Key Combinations in JavaFX
- How to Create Stacked Menus in JavaFX
- How to Create a Border Glow Effect in JavaFX.
Our software libraries allow you to
| Convert PDF files to HTML |
| Use PDF Forms in a web browser |
| Convert PDF Documents to an image |
| Work with PDF Documents in Java |
| Read and write HEIC and other Image formats in Java |