

Code quality is arguably one of the most important parts of Software Development – badly written code can cost time and money as you’ll waste time working out what code actually does before you can do anything with it. There are many ways to prevent bad quality code from being written, but they often involve spending lots of time training people and breaking bad habits (and we all know how much some people like change). Enter SonarQube – the automated code quality inspection tool.


So… what exactly is SonarQube?
SonarQube is a free (there’s also a paid version offering more features and support for enterprise) tool that provides continuous inspection and analysis of code quality (much like Hudson or Jenkins do continuous integration) checking your codebase for bugs, vulnerabilities and code smells, and presents it all in a nice report with lots of detail. As with most things, by automating code quality checks, developers like myself can enjoy spending more time working on cool new projects and features while a robot does the boring parts my job for me.
However, SonarQube doesn’t do everything – practices such as peer code reviews and allocating time each week to reduce existing technical debt are still necessary. What SonarQube does best is improving code quality by preventing more issues getting into the codebase – there isn’t much point in fixing an issue if you aren’t going to try and stop it from happening again in the first place!
The SonarQube platform is made up of multiple parts:
SonarQube Server:
This processes and manages code analysis reports and provides a nice little front end so you can view everything wrong with your code and configure SonarQube.
Database:
This simply stores any configurations and all the report data / code quality snapshots.
Plugins:
These provide additional functionality such as support for different SCM engines, authentication, and integration for tools such as Google Analytics, GitHub and GitLab.
Scanners:
These are what actually scan your code – they can run either locally or on your Build / CI servers, analyzing projects and reporting back to the server.
You can also get SonarLint, an IDE extension that provides real-time code analysis in your IDE, helping to fix and avoid potential issues before you commit. Even better, SonarLint is standalone. You don’t need to set up a SonarQube server – just install the plugin and you’re ready to go!
How to setup SonarQube?
This is covered in a separate blog post How to setup SonarQuube.
Viewing the report:
Clicking on your project from the Project Overview page will show you an overview of the latest code quality snapshot for your project: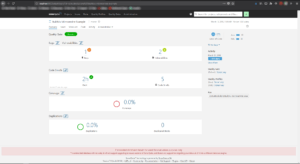

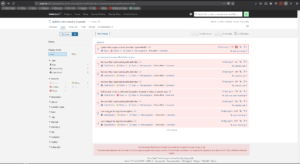
- > Under the project title, the “Issues” tab will show you a list of all the detected issues. You can filter and sort the data using the options on the left, and view more detail by clicking on each issue.
- > The “Measures” tab shows you many different graphs that visualize different bits of data such as security, reliability and coverage by unit tests.
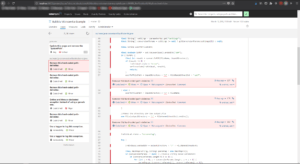
- > The “Code” tab shows you each individual file in the project and provides data on each such as no. of bugs / code smells, duplicate code and total lines of code.
- > The “Activity” tab contains a graph which gives an overview of the total number of issues across each scan.
- > Last of all, the “Administration” tab lets you configure settings specific to the selected project.
That covers the basic setup and usage. From here, you could set up a Hudson / Jenkins job to automatically run scans, add email notifications to let people know when they introduce issues or expand SonarQube to include checks by tools such as CheckStyle, FindBugs and PMD.
Do you use SonarQube / SonarLint to manage code quality in your projects? Do you think it’s worth using, or that there’s a better alternative? Let us know your thoughts in the comments below.