
Most people will already be familiar with profiling, but you might be less aware of the different types of profilers on offer. A recent issue we had upon the release of Java 8 proved awkward to resolve using a traditional profiler, but Sampling proved well suited to the task.
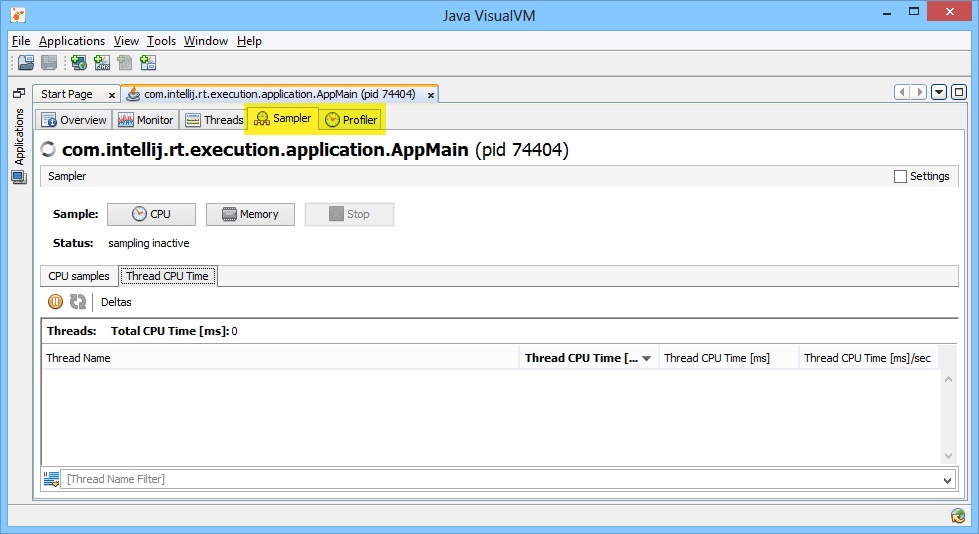
Helpfully, Java comes with both a traditional profiler and a sampler in the form of VisualVM. I’m just going to be talking about CPU profiling, although the approaches to memory are similar.
VisualVM’s profiler works by “instrumenting” all of the methods of your code. This adds extra bytecode to your methods for recording when they’re called, and how long they take to execute each time they are.
VisualVM’s sampler, however, takes a dump of all of the threads of execution on a fairly regular basis, and uses this to work out how roughly how much CPU time each method spends.
So what was our problem with profiling?
We test our software by running our PDF to HTML5 converter on a large number of diverse PDF files which make use of different parts of the PDF specification and flagging up any changes in the output. On Java 8, this was taking 48 minutes.
One problem with instrumented profiling is that it adds a constant amount of extra execution time to every single method call. Sometimes – such as in image processing – small, quick methods are called many, many times, adding a great deal of time to the execution. Profiling our tests this way would take hours!
Sampling, however, takes a more or less constant amount of time each second to record stack traces for each thread. This only added 5 – 10 minutes of execution time in total, and still provided us with a good idea of where the problems lay.
One quirk of sampling is that the number of invocations recorded is not necessarily accurate, since a short method could easily start and finish between stack dumps. It appeared as though a method in our library was called three times as often in Java 8 as it was in Java 7 – the truth, however, is that it was taking three times as long, and thus was three times as likely to be caught in a dump.
Perhaps the lesson here is that sampling is most useful for recording the amount of CPU time spent, rather than the number of invocations. Still, there’s a very high chance that this will identify any problems, and do it much faster than the standard profiler.
Which do you prefer? Let us know in the comments below.