
Recently, I have been working on improving mobile support in the content produced by our PDF to HTML5 converter. One problem that I have encountered is how to debug iOS Safari, particularly if you are not a Mac user.
If you are a web developer, you are likely very familiar with the tools available to you when debugging a web page or web app in a desktop browser, but how do you debug when developing for a mobile device such as the iPad or iPhone?
The answer is that you debug remotely, using the same tool as you would on desktop, except connected to your mobile device. If you are debugging Safari on iOS this will require Safari version 6 and up. Windows & Linux developers will be disappointed to hear that the latest version of Safari available for Windows is version 5, and it’s not available at all on Linux.
If you don’t own or have access to a Mac this can be very frustrating (though I would not say it’s the most frustrating thing about developing a web app for iOS, there are many). It would be great if Apple offered Virtual Machines with Safari pre-installed for testing, as Microsoft does for Internet Explorer. Fortunately, all is not lost – there are some alternatives available which I will discuss below.
Remote Debugging iOS Safari on OS X:
Firstly, you need to have a device running iOS, such as an iPad or an iPhone that you can connect by USB to a Mac computer with Safari version 6 onwards installed.
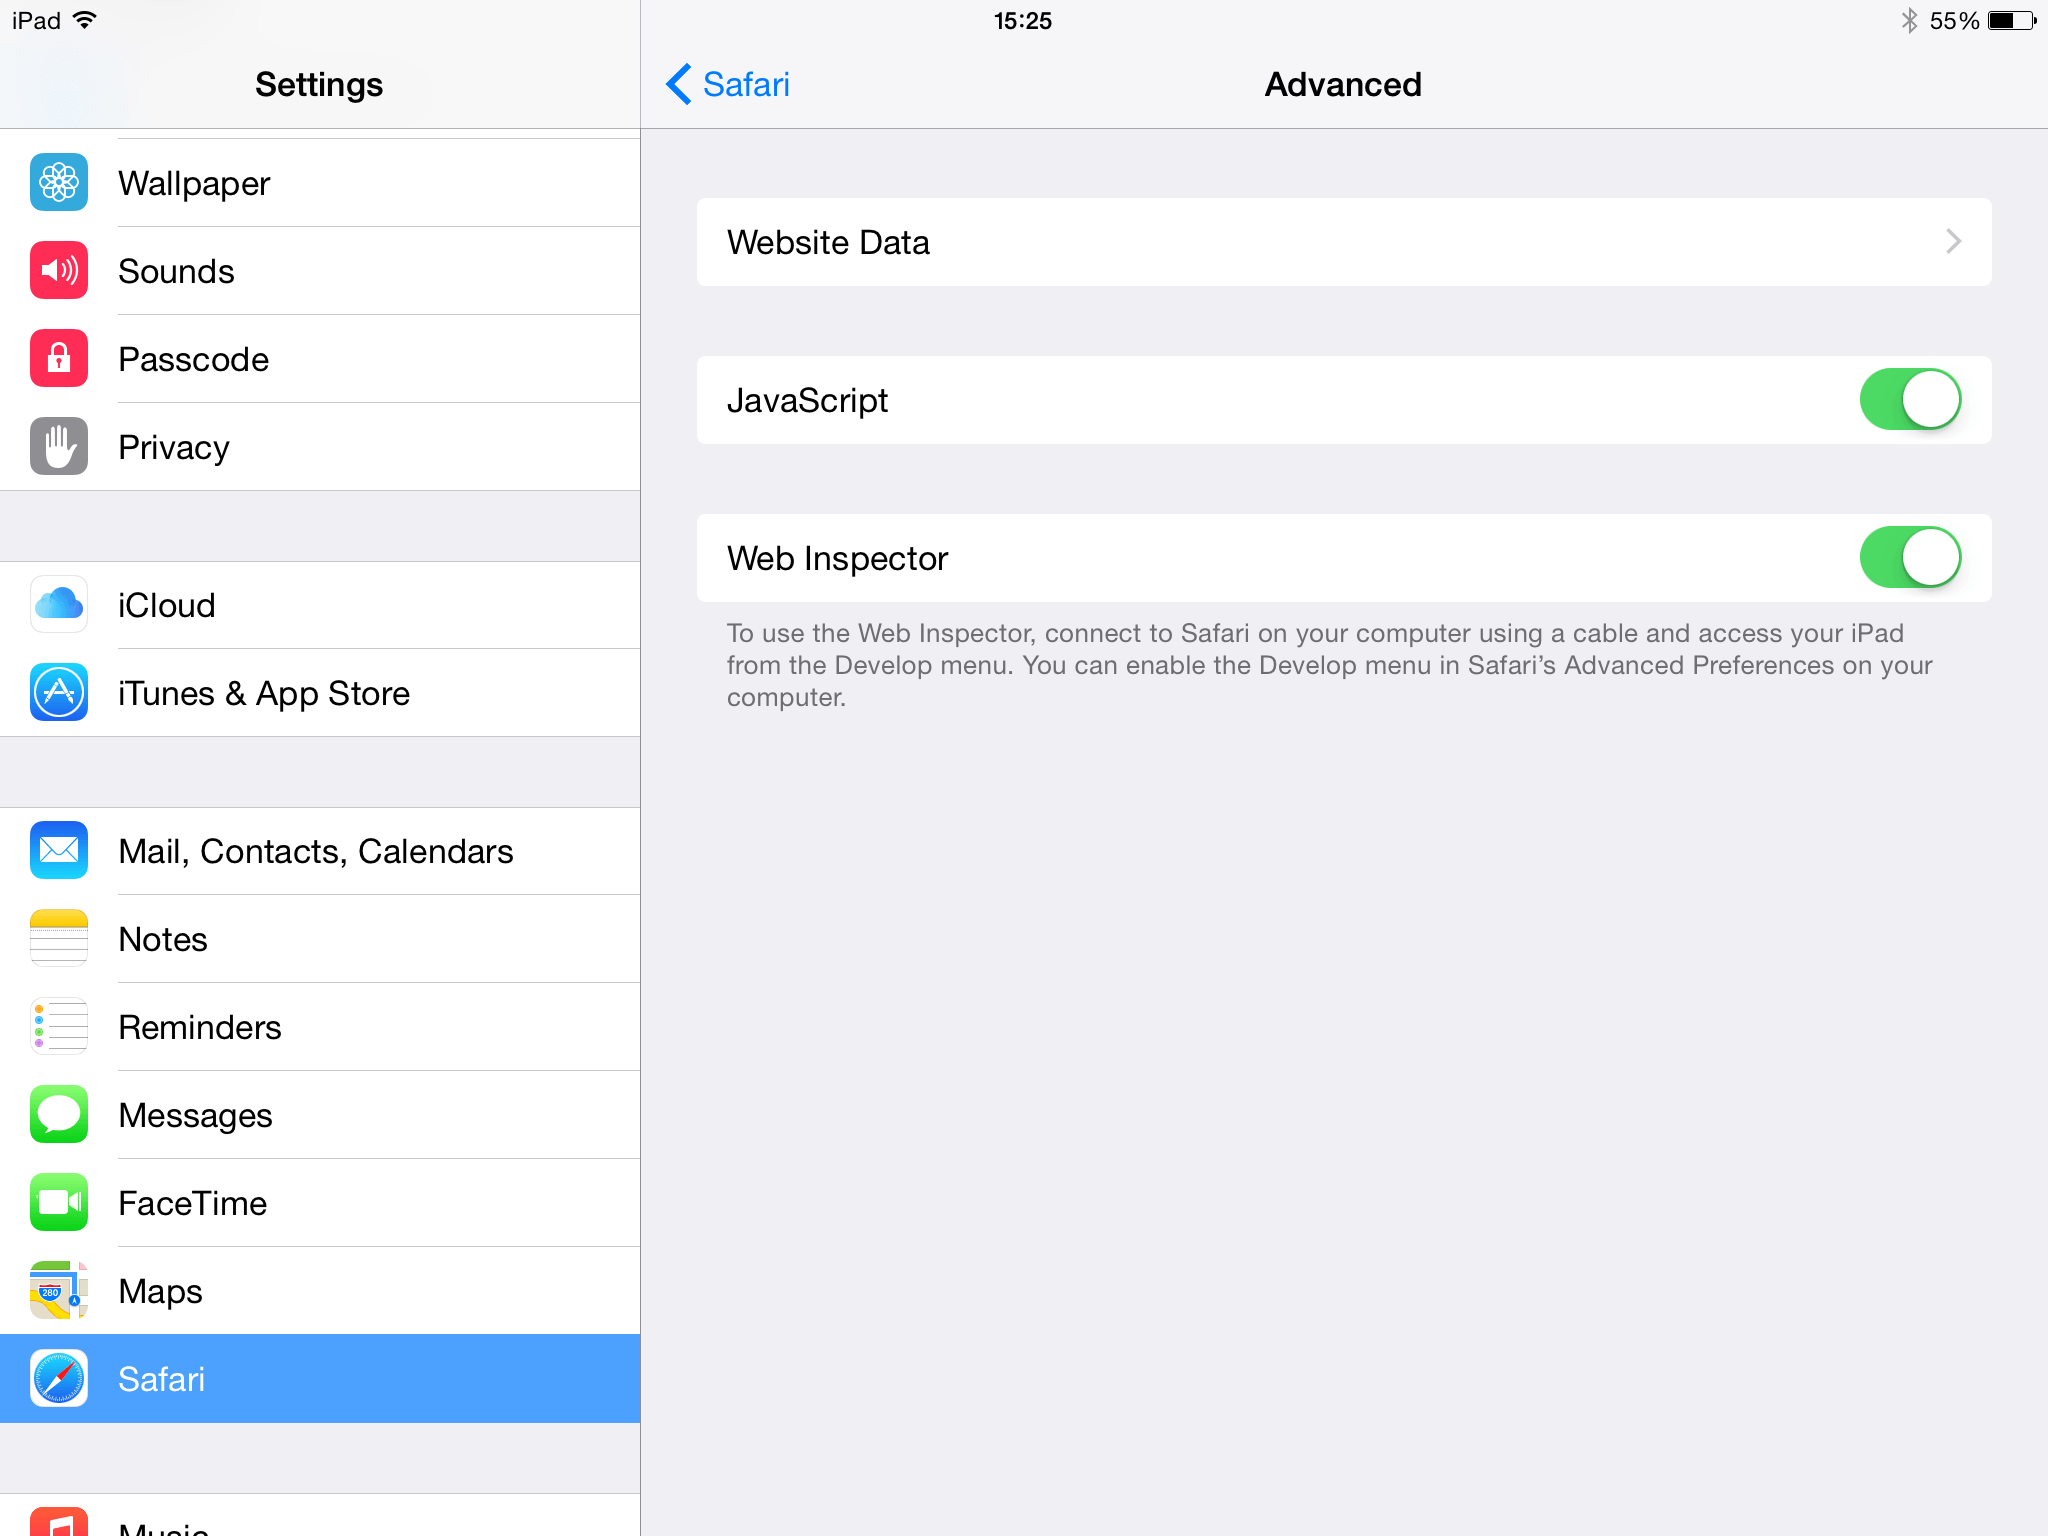
Next, you need to enable ‘Web Inspector’ on your iOS device. You can do this by going to Settings > Safari > Advanced, and toggling Web Inspector so that it is enabled.
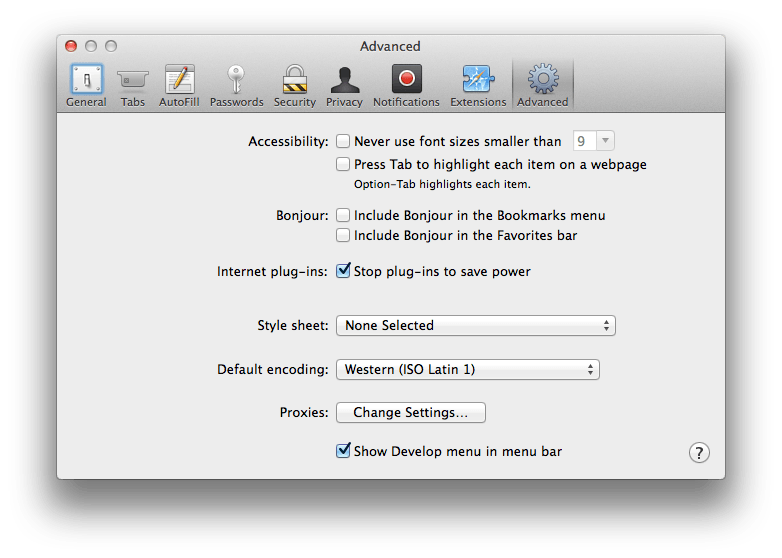
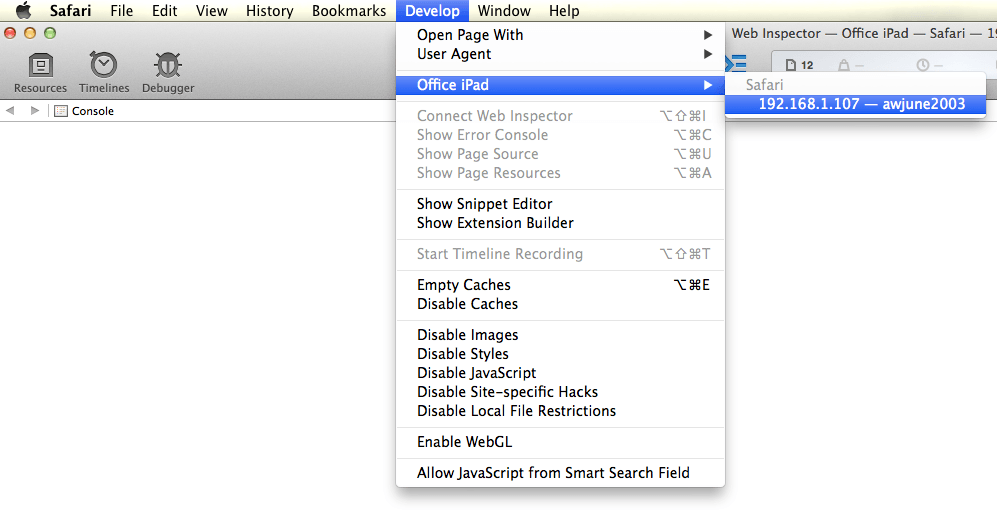
Then, you need to enable the Develop menu in Safari on your Mac computer if it is not already enabled. You can do this by going to Safari > Preferences > Advanced, and ticking the check box for Show Develop menu in menu bar.
Remote Debugging iOS Safari on Windows and Linux:
[Update – Jan 2019] Since writing this article, the recommended solution is no longer available. There is however a new tool which allows you to debug iOS Safari using the Chrome Web Developer tools. You can find instructions for setting this up here: RemoteDebug iOS WebKit Adapter. I have tested this tool (in January 2019) and can confirm it is working.
There are very few options available to the web developer using Windows, and even fewer for those using Linux. Apparently, the Telerik Platform AppBuilder includes a Chrome Developer Tools capable of remote debugging pages in Safari.
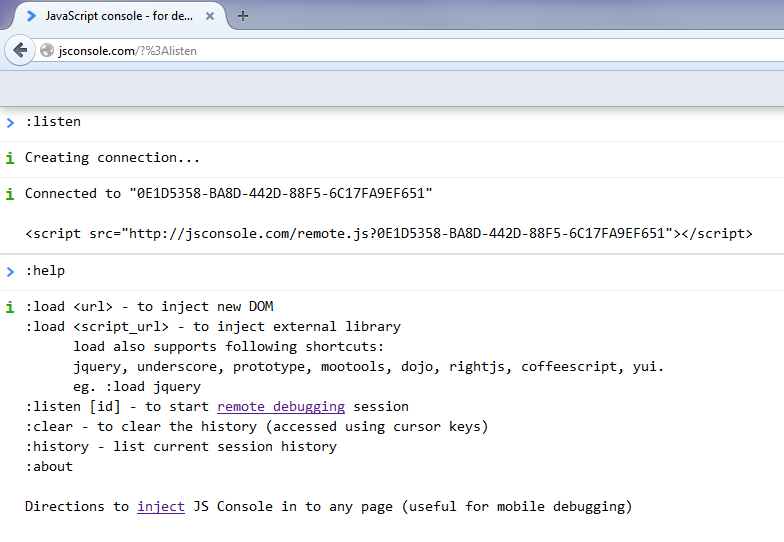
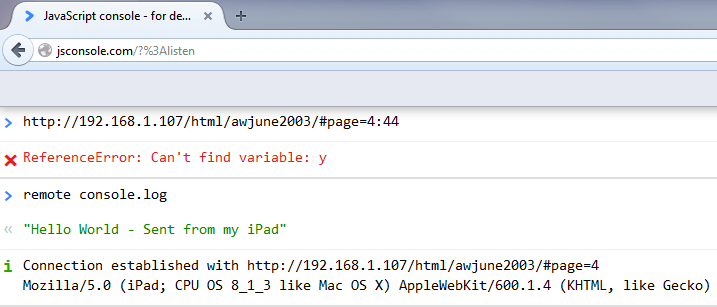
In my option, the best solution for debugging Safari on Windows and Linux is to use a really cool web app called JSConsole. JSConsole works by inserting a script tag into your web page that overrides the console behavior. Rather than writing logs and errors to a console you can’t see, instead they will be streamed to a jsconsole session open in your desktop web browser that will be listening to your device.
To start, go to jsconsole.com and run :listen in the prompt. This will give you a unique session ID and a script tag that you insert into your mobile web page.
If you found this article useful, feel free to try our PDF to HTML5 converter online for free.