Recently, I have been working on improving mobile support in the content produced by our PDF to HTML5 converter. One problem that I have encountered is how to debug iOS Safari, particularly if you are not a Mac user.
If you are a web developer, you are likely very familiar with the tools available to you when debugging a web page or web app in a desktop browser, but how do you debug when developing for a mobile device such as the iPad or iPhone?
The answer is that you debug remotely, using the same tool as you would on desktop, except connected to your mobile device. If you are debugging Safari on iOS this will require Safari version 6 and up. Windows & Linux developers will be disappointed to hear that the latest version of Safari available for Windows is version 5, and it’s not available at all on Linux.
If you don’t own or have access to a Mac this can be very frustrating (though I would not say it’s the most frustrating thing about developing a web app for iOS, there are many). It would be great if Apple offered Virtual Machines with Safari pre-installed for testing, as Microsoft does for Internet Explorer. Fortunately, all is not lost – there are some alternatives available which I will discuss below.
Remote Debugging iOS Safari on OS X:
Firstly, you need to have a device running iOS, such as an iPad or an iPhone that you can connect by USB to a Mac computer with Safari version 6 onwards installed.
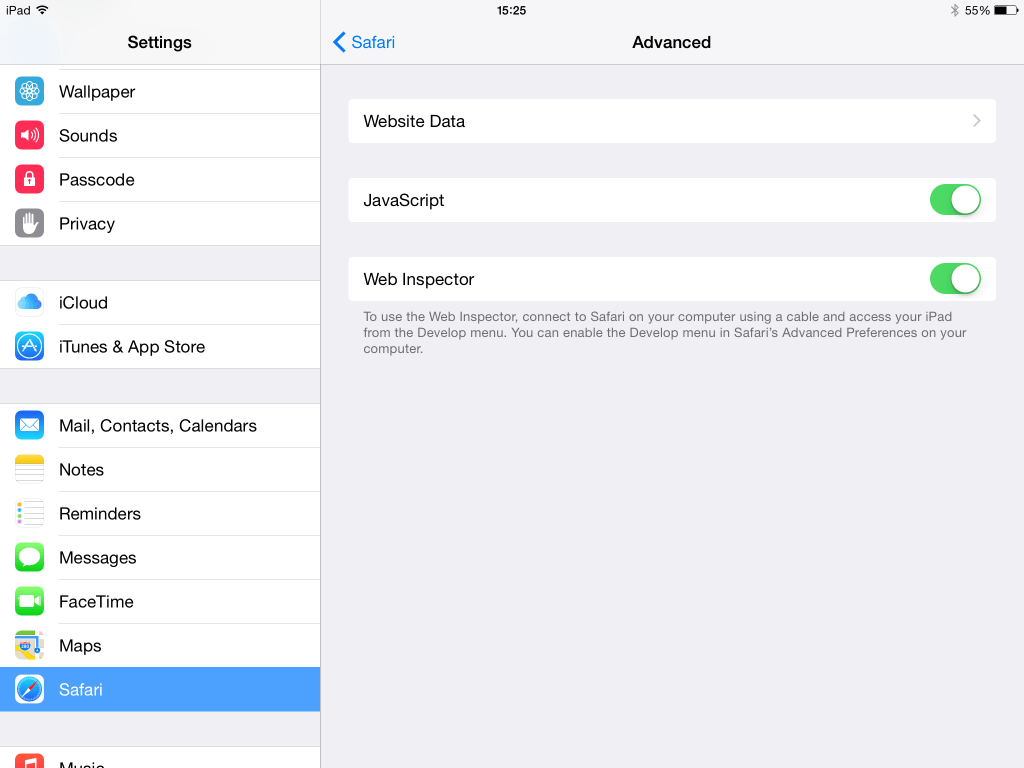
Next, you need to enable ‘Web Inspector’ on your iOS device. You can do this by going to Settings > Safari > Advanced, and toggling Web Inspector so that it is enabled.
Then, you need to enable the Develop menu in Safari on your Mac computer if it is not already enabled. You can do this by going to Safari > Preferences > Advanced, and ticking the check box for Show Develop menu in menu bar.
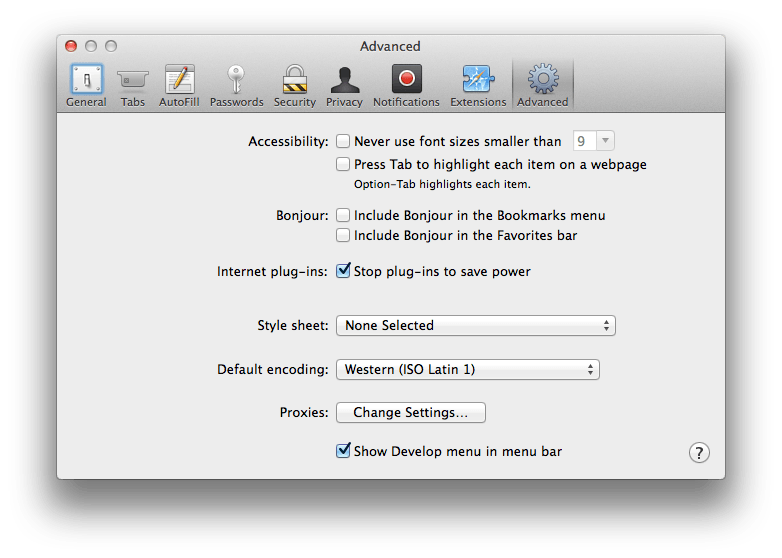 Now, if your iOS device is plugged in to your computer with the web page you wish to debug currently open, you can go to Develop > iOS Device Name in desktop Safari, and click on the page you wish to debug.
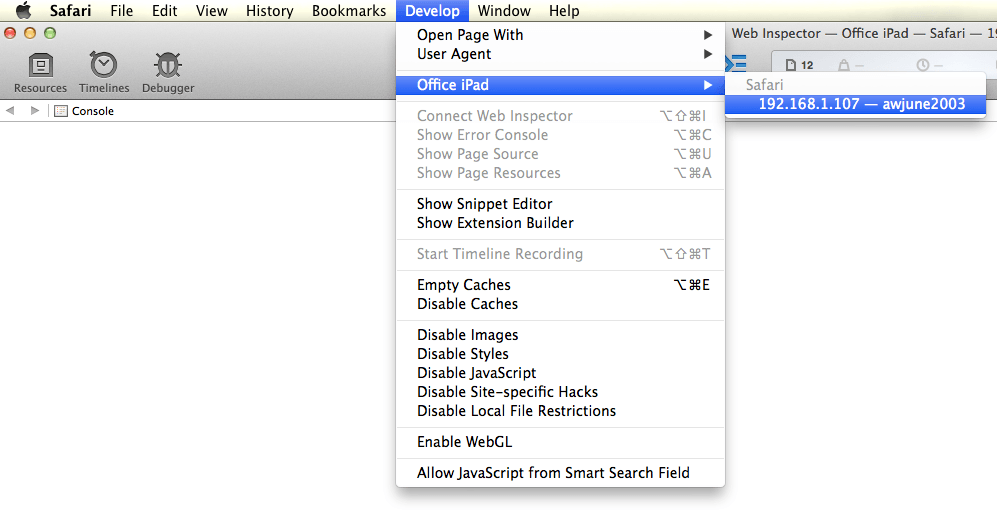 You can now view and update the DOM, access the JavaScript console and more.
Remote Debugging iOS Safari on Windows and Linux:
[Update – Jan 2019] Since writing this article, the recommended solution is no longer available. There is however a new tool which allows you to debug iOS Safari using the Chrome Web Developer tools. You can find instructions for setting this up here: RemoteDebug iOS WebKit Adapter. I have tested this tool (in January 2019) and can confirm it is working.
There are very few options available to the web developer using Windows, and even fewer for those using Linux. Apparently, the Telerik Platform AppBuilder includes a Chrome Developer Tools capable of remote debugging pages in Safari.
In my option, the best solution for debugging Safari on Windows and Linux is to use a really cool web app called JSConsole. JSConsole works by inserting a script tag into your web page that overrides the console behavior. Rather than writing logs and errors to a console you can’t see, instead they will be streamed to a jsconsole session open in your desktop web browser that will be listening to your device.
To start, go to jsconsole.com and run :listen in the prompt. This will give you a unique session ID and a script tag that you insert into your mobile web page.
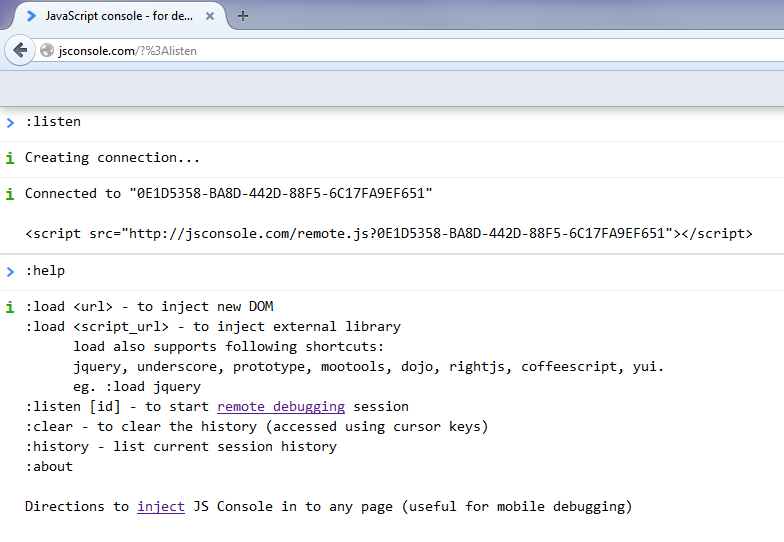 Now, any console output that your mobile page generates will be streamed to the console open in your desktop web browser, including any errors!
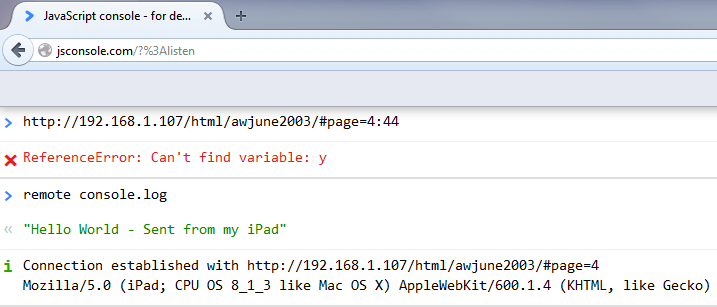 It is certainly no replacement for a full web inspector, but it can get you out of trouble when you don’t have access to a Mac.
If you found this article useful, feel free to try our PDF to HTML5 converter online for free.
Our software libraries allow you to
| Convert PDF files to HTML |
| Use PDF Forms in a web browser |
| Convert PDF Documents to an image |
| Work with PDF Documents in Java |
| Read and write HEIC and other Image formats in Java |
Other options for remote debugging on Windows and Linux:
* https://creative.adobe.com/products/inspect
Thanks for the suggestions Matt, I had not come across those in my searching.
I’ve taken a look and it looks like Adobe Edge Inspect uses weinre internally. It’s actually really good!
Thanks for pointing to JS Console and explaining how to use it! It helped me fix an issue on iOS today. I also found https://github.com/google/ios-webkit-debug-proxy, but could not install it on Ubuntu 15.04 due to unmatched dependencies. JS Console for the win.
Thanks for the iOS debugging guide. I have followed your instructions using a Mac Mini and iPad, but even though I have my iPad plugged in and, using Safari, have chosen the site I want to debug, I get ‘No Inspectable Applications’ when I choose my iPad from the Mac Mini Safari Develop menu. Can you think of anything that I might need to do?
Thanks!
Richard.
When I have encountered that issue in the past it has been because of a version miss-match. My advice would be to make sure that everything is up to date.
I use another trick:
1: I use an existing div or I add a div to show the console.log in the div in the browser itself
2: javascript:
var myDiv;
console.origLog = console.log;
console.log = function(x) {
if(!myDiv) myDiv = document.getElementById(‘myDiv-id’);
if(myDiv) myDiv.innerHTML = x;
else console.origLog(“can not determine myDiv”);
}
Thanks for the article. But I only get multiple times:
Connected to "352576ab-4922-4ca1-a850-15ffc5faabea"
But I never get a “connection established …” as seen in your screenshot. Is this service still working?
It’s not working for me either.
I have tried running it locally (it’s available on GitHub at https://github.com/remy/jsconsole) but it still has the same issue.
Thanks Leon. It would have been such a handy tool. Now I am stuck again. The apache link from the first comment does not exist anymore either. So I need to buy a Mac I guess … 😀
Great idea to use jsconsole, injecting the script worked as described. All my calls to the console are now logged to this remote session, perhaps the people who are having trouble have inserted the script at the end of their page? You’ll need to make this the first script if you want to capture all logs sent to the console.
thanks for posting this! 🙂 finally solved an issue in my app that was running me crazy cause I couldn’t see the error message :]
It would appear that JSConsole doesn’t provide this functionality anymore. https://github.com/remy/jsconsole/issues/103
Thank you! Very useful tool. It helped me to fix a difficult bug on Safari.
I can’t get it to work with Linux (Ubuntu 18.04). You wrote:
> Remote Debugging iOS Safari on Windows and Linux:
> [Update – Jan 2019]
…
The instructions in the “RemoteDebug iOS WebKit Adapter” site that you referred to, instruct to use Chrome Canary. But there is no Chrome Canary for Linux (see here: https://askubuntu.com/questions/309813/how-to-have-google-chrome-canary-on-ubuntu).
What flavor and version of Chrome did you use, to confirm that it is working?
Thanks
I’m afraid I’ve not tested on Linux. Looking at the history of the readme, it looks like the suggestion to use Chrome Canary was added over 3 years ago, so I suspect the required functionality is now in the stable version (I believe it’s the network discovery feature).