
Previously I wrote an article about 5 tools to help you write better java code which helped to improve our code but also our productivity. At IDR Solutions we are always looking at ways to improve our code and lately, we have been looking at improving our java code in Buildvu (our PDF to HTML5 Converter), JDeli (our Java Image Library) and JPedal (our Java PDF Library). I have noticed that recently one of the areas of focus has been on improving and Java Performance.
In this article I will be taking a look at 9 tools to help you with Java Performance Tuning, some are used by us at IDR Solutions and others that we may use for personal projects.
NetBeans Profiler
The NetBeans profiler is a modular add-on that is used to provide the profiling functionality for the NetBeans IDE, which is an open-source integrated development environment. NetBeans IDE supports the development of all Java application types (Java SE (including JavaFX), Java ME, web, EJB and mobile applications) out of the box.
This profiler includes functions such as CPU, memory and threads profiling but also provides additional tools and functionality for basic JVM monitoring, which is extremely useful for developers who need to solve memory or performance-related issues.
JProfiler

JProfiler was previously mentioned in my previous article but remains an extremely good Java profiler combining CPU, Memory and Thread profiling into one application and is useful for developers as it can be used to analyze performance bottlenecks, memory leaks, CPU loads and resolve threading issues and supports local profiling (analysis of applications that are running on the same machine on which the JProfiler software is installed) and remote profiling (this is where it allows for the analysis of Java applications which are running on remote machines which JProfiler software is not installed on.).
JProfiler is a commercially licensed Java profiling tool developed by EJ-technologies GmbH and is mainly designed for use with Java EE and Java SE applications.
GC Viewer
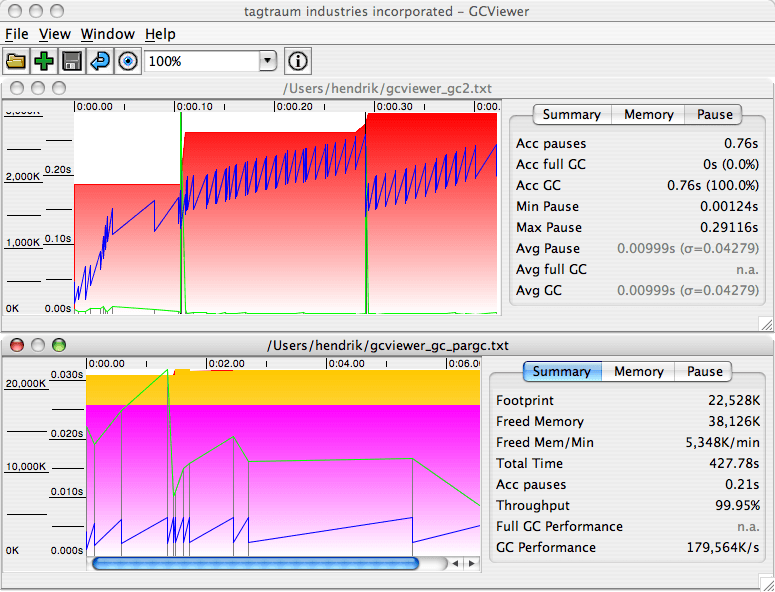
GC Viewer is available to be downloaded for free (from its website and GitHub)and is an open-sourced tool that can be used to visualize data produced by the Java VM options using the vmflags -verbose:gc and -Xloggc:. GC Viewer can be used to calculate garbage collection-related performance metrics which include throughput, accumulated pauses, longest pause and more. It is often very useful when you want to tune the garbage collection of a particular application by changing generation sizes or setting up the initial heap size.
GC Viewer is an open-sourced tool by tagtrum industries incorporated is a tiny Raleigh, North Carolina based software and consulting company founded in 2004 from the not-for-profit project tagtraum industries started in 1999.
VisualVM

VisualVM is a tool derived from the NetBeans platform and its architecture is modular in design meaning it’s easy to extend through the use of plugins.
Visual VM allows you to get detailed information about your Java applications while they are running on a Java Virtual Machine (JVM). Data generated can be generated and retrieved by the Java Development Kit (JDK) tools and all the data and information on multiple Java Applications can be viewed quickly both local and remote running applications. It is possible to also save and capture the data about the JVM software and save the data to the local system, and then view the data later or share it with others.
Visual VM can do CPU Profiling, Memory Profiling, run garbage collections, take snapshots and more.
Java Performance Analysis Tool (Patty) *Beta
The “Patty” project is an open-source project available to download from Source Forge and is aimed at providing a profiling tool for Java 1.5.0 and higher Virtual Machines. It differentiates itself from other profilers by maintaining a very high emphasis on targeted profiling and allows users to switch profiling features on and off at runtime.
Currently, it’s in a state of beta but as some strong features such as analyses of method execution, code coverage, thread contention can be used for profiling overheads (memory CPU, etc) and have its information sent to other computers via the TCP/IP Socket, as an easy to use GUI and can be used to analyze heaps, and an instrument and de-instrument classes while your application is running. (preparation steps in a Java build cycle.
JRockit – Mission Control

JRockit is a proprietary Java Virtual Machine (JVM) originally developed by Appeal Virtual Machines and acquired by BEA Systems in 2002 and later became part of Oracle via Sun Microsystems.
Oracles JRockit is a complete solution for Java SE which includes a high-performance JVM, profiling, monitoring and diagnostics tools, and can be used for predicting latency in Java applications.
The current iteration of JRockit is bundled with a set of tools called JRockit Mission Control. The tools include a console used for management and are capable of visualizing garbage-collection and other performance statistics. It can also be used as a runtime performance profiling tool called Runtime Analyzer and can also analyze memory issues.
Eclipse Memory Analyzer
The Eclipse Memory Analyzer is a Java heap analyzer that helps you find memory leaks and reduce memory consumption. It is more suited for being a general-purpose toolkit to analyze Java heap dumps and calculation of its size. It can be used also reports leak suspects and memory consumption anti-patterns.
Java Interactive Profiler
JIP is a high-performance, low overhead profiler that is written and developed in Java, it currently operates under a BSD license and is available from Source Forge to download. For developers using JIP, there is the ability to turn the profiler on and off while the VM is running also it is possible to also filter out classes and packages and control the output.
Profiler4J

Profiler4j is a dedicated CPU profiler for Java that is user-friendly and supports remote profiling and can be configured “on the fly”. Notable features include that it’s based on dynamic bytecode instrumentation, it has no native library nor requires an executable. Further notable features are that it’s done 100% in Java, can provide graphical information with a call graph, call tree, memory monitor, and class list. and supports fine-grained configuration. It is currently released under the Apache License v2.0 and is available to download from Source Forge.
Hopefully, you will have found this list of tools useful.
What tools do you use to help improve your code, let us know!
Our software libraries allow you to
| Convert PDF to HTML in Java |
| Convert PDF Forms to HTML5 in Java |
| Convert PDF Documents to an image in Java |
| Work with PDF Documents in Java |
| Read and Write AVIF, HEIC, WEBP and other image formats |
In case the performance problems you face include memory leaks or suboptimal GC configuration, you might also be interested what Plumbr has to offer in this regard.
Thanks for your suggestion Ivo, I always think its good to have a broad range of tools that complement one another and help to improve work with coding Java.
I’m worked on performance issues in several large scale enterprise projects and always used YourKit profile, such as a great tool. Actually i’m very surprised that YJP not in top 10 products
A top 10 always has an element of personal selection. Lots of our customers swear by YourKit and it is a great product. We tried both JProfiler and YKK several years ago and our personal preference was for JProfiler so we are more familiar with that. We are very lucky is the Java world to have such a range of excellent choices.
Disclaimer: I work for YourKit, but I would like to share my personal opinion.
The selection of the reviewed tools is really strange for me. JProfiler is good, MAT or NetBeans is usefull is several situations
but I have a feeling that some other “top 9” tools even do not start on modern JVMs.
– Last news from Java Interactive Profiler is dated by 2008 (6 years ago).
– Profiler4j is still in beta, and was updated last time in 2006 (8 years ago).
– Java Performance Analysis Tool (Patty) *Beta does not see any update since 2006
Thanks for adding the information. Again it is a personal list and everyone’s will be different. We were at the PDF Association conference yesterday and the IText team were saying they still stick to Java5 compatibility (even though Java6 is now dead) because a significant numbers of users are still on that platform. Alex wanted a good representative list of tools (commercial and open source) with different levels of functionality and it is his personal selection.
YKK is an excellent tool (a lot of our customers swear by it) and it should be on anyone’s list in the market for a modern commercial tool.
Please feel free to add any other suggestions of tools worth considering.
Don’t forget to add the open source utility jvmtop ( https://github.com/patric-r/jvmtop ).
It’s a performance console monitoring tool for java, even including a profiler.